March 24, 2017
Odysseus can be used for the preparation and processing of sensor data for monitoring a wind farm. As part of a SCADA system, Odysseus for example, can pre-process the data and calculate, for example, a power curve and the actual deviations from the measured values.
The data can be transformed, filtered and aggregated on the fly so that the diagrams and visualizations only receive the relevant data on the dashboard - an expensive store in a database is not necessary - but is also possible. An intelligent archiving can also be implemented by, for example, only archiving important or aggregated information in normal mode, but detailed if an error occured or in maintenance mode.
The flexible query interface of Odysseus allows for example, that the visualization determines the query itself. Thus, the processing is performed only when the visualization is visible. And the additional definition of new visualization with appropriate queries is much more smoothly. When opening a visualization Odysseus automatically ensures in the background that the added queries are most efficiently integrated into the ongoing processing by, for example, reusing existing processing steps.
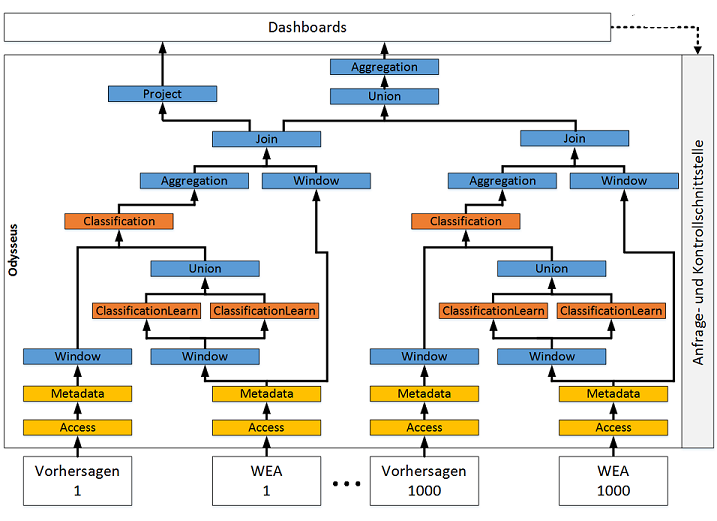
Since the processing steps of the query languages are easily configurable, versatile and customizable, systems can be scaled up and this at run time in minutes from one single to several thousand wind turbines.
Forecast of Wind Energy
Through the use of machine learning techniques Odysseus may also be used for the prediction of the generated wind energy. Especially the real-time processing focuses on providing short-term prognosis.In addition to the actual measurement data of the wind turbines wheather data is also taken into account. With the help of classification and regression methods a model can be generated from current measurements. This model can then be used to calculate the expected performance on the basis of predictions.The flexible architecture of Odysseus also allows you to use multiple regression procedures in parallel, in order to subsequently perform an ensemble forecast.
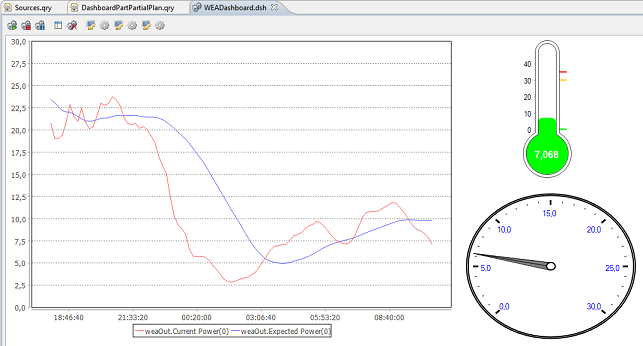 The figure shows the predicted and the actual wind energy, in which a very simple ensemble forecast with three different regression methods has been performed. The prediction-steps or the pipeline can be easily implemented through a query, this allows to add new operators or machine learning techniques in order to enable new methods for future wind energy forecasting methods.
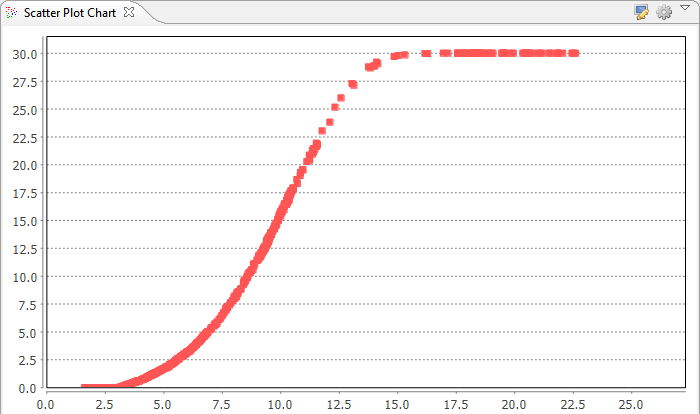
Performance Curve Calculation
By connecting the sensors of the wind turbine and the weather conditions in the area, Odysseus can be used to calculate the power curve:
Further details on the calculation according to IEC 61400-12 and the Langevin method can be read in this publication (German):
Leistungskennlinienberechnung von Windenergieanlagen unter Einsatz eines Datenstrommanagementsystems